|
~
|
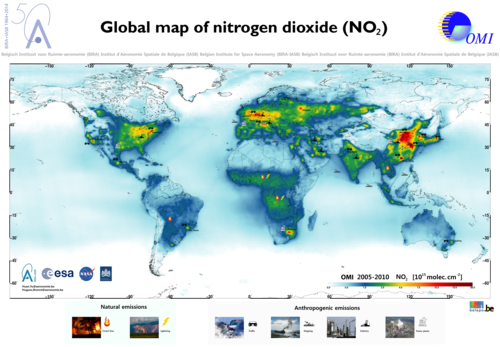
In the framework of the preparation of the ESA Sentinel-5 Precursor (S5-P) mission, which is planned for launch in early 2016, UV-Vis retrieval expert scientists at BIRA-ASB have been working on the derivation of high quality tropospheric trace gas data products derived from the heritage Ozone Monitoring Instrument (OMI) flying on board of the NASA AURA platform since 2004. These demonstration data sets illustrate how well current satellite sensors can map key atmospheric pollutants, such as formaldehyde (H2CO), nitrogen dioxide (NO2), and sulphur dioxide (SO2), at the global scale. It is anticipated that the improved performances of the future TROPOMI/S5-P instrument will allow to document pollution sources with even better accuracy and at finer spatial scales. The global maps of H2CO, NO2, and SO2 presented below have been recently produced at BIRA-IASB as a contribution to the 50 years anniversary Open Days. They display multi-year averaged vertical columns derived from OMI measurements. Details as fine as 13x24 km2 can be identified corresponding to a wide range of natural and anthropogenic emission sources. The maps can be freely downloaded and used without any restriction for non-commercial applications, excluding scientific publications. In case of public presentation of any kind (e.g. poster or talk), adequate credit to the UV-VIS DOAS group of the Belgian Institute for Space Aeronomy should be given.
Download the maps EnglishA4 size PDF document (29.7 x 21 cm)
Français/NederlandsFull size PNG image (150 x 104 cm)
Image sizes are based on 300 DPI resolution. |
|||||


